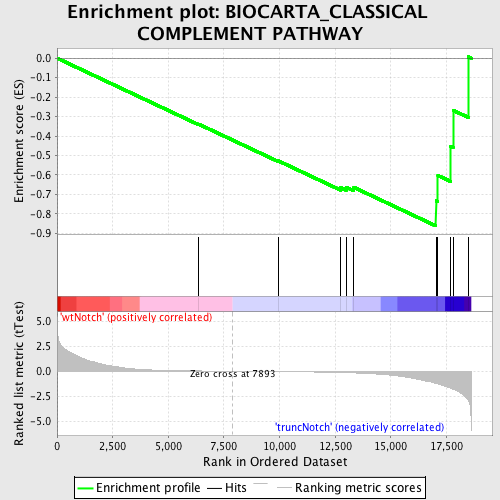
Profile of the Running ES Score & Positions of GeneSet Members on the Rank Ordered List
| Dataset | Set_03_truncNotch_versus_wtNotch.phenotype_truncNotch_versus_wtNotch.cls #wtNotch_versus_truncNotch.phenotype_truncNotch_versus_wtNotch.cls #wtNotch_versus_truncNotch_repos |
| Phenotype | phenotype_truncNotch_versus_wtNotch.cls#wtNotch_versus_truncNotch_repos |
| Upregulated in class | truncNotch |
| GeneSet | BIOCARTA_CLASSICAL COMPLEMENT PATHWAY |
| Enrichment Score (ES) | -0.862046 |
| Normalized Enrichment Score (NES) | -1.5467654 |
| Nominal p-value | 0.007168459 |
| FDR q-value | 0.3597811 |
| FWER p-Value | 0.991 |
| PROBE | DESCRIPTION (from dataset) | GENE SYMBOL | GENE_TITLE | RANK IN GENE LIST | RANK METRIC SCORE | RUNNING ES | CORE ENRICHMENT | |
|---|---|---|---|---|---|---|---|---|
| 1 | C8B | 6770687 | 6350 | 0.029 | -0.3382 | No | ||
| 2 | C9 | 5550452 5690253 | 9944 | -0.035 | -0.5276 | No | ||
| 3 | C8A | 2190601 | 12743 | -0.126 | -0.6646 | No | ||
| 4 | C6 | 1770154 2900129 | 12992 | -0.141 | -0.6629 | No | ||
| 5 | C1R | 2340025 3290152 4850452 | 13336 | -0.167 | -0.6636 | No | ||
| 6 | C1QB | 5910292 | 17030 | -1.214 | -0.7329 | Yes | ||
| 7 | C3 | 1740372 | 17116 | -1.267 | -0.6027 | Yes | ||
| 8 | C1QA | 5390687 | 17695 | -1.694 | -0.4535 | Yes | ||
| 9 | C1QC | 5700131 | 17801 | -1.798 | -0.2679 | Yes | ||
| 10 | C2 | 5390465 | 18490 | -2.930 | 0.0068 | Yes |

